The Power of the Realie Assistant
Immediate answers powered by the most comprehensive property data


Alex Franzen
Co-founder & CTO
January 31, 2025
The Realie Assistant has come a long way!
The Realie assistant has come a long way in the past year. Leveraging the power of 180 million parcels and over 9 billion data points, the Realie assistant can quickly and effectively answer complex questions about any real estate market in the United States. The days of needing your strategy team to learn SQL and spend hours running complex queries are officially over
From market trends, to block specific information, the assistant can:
Answer specific questions about a given property
Generate charts depicting historical data
Help you formulate investing strategies
Let’s give it a test drive:
“The days of needing your strategy team to learn SQL and spend hours running complex queries are officially over”
-Alex Franzen, CTO
Test Drive
Let’s say I own a single-family home in the Virginia area; I purchased this home in 2020 and am considering selling it to purchase another home in the area. I’d like to know about how the market in the area is faring, in the context of both the county market, as well as within a mile radius of the home.
To start, let’s ask the assistant to generate a chart of the micro market within a mile radius.
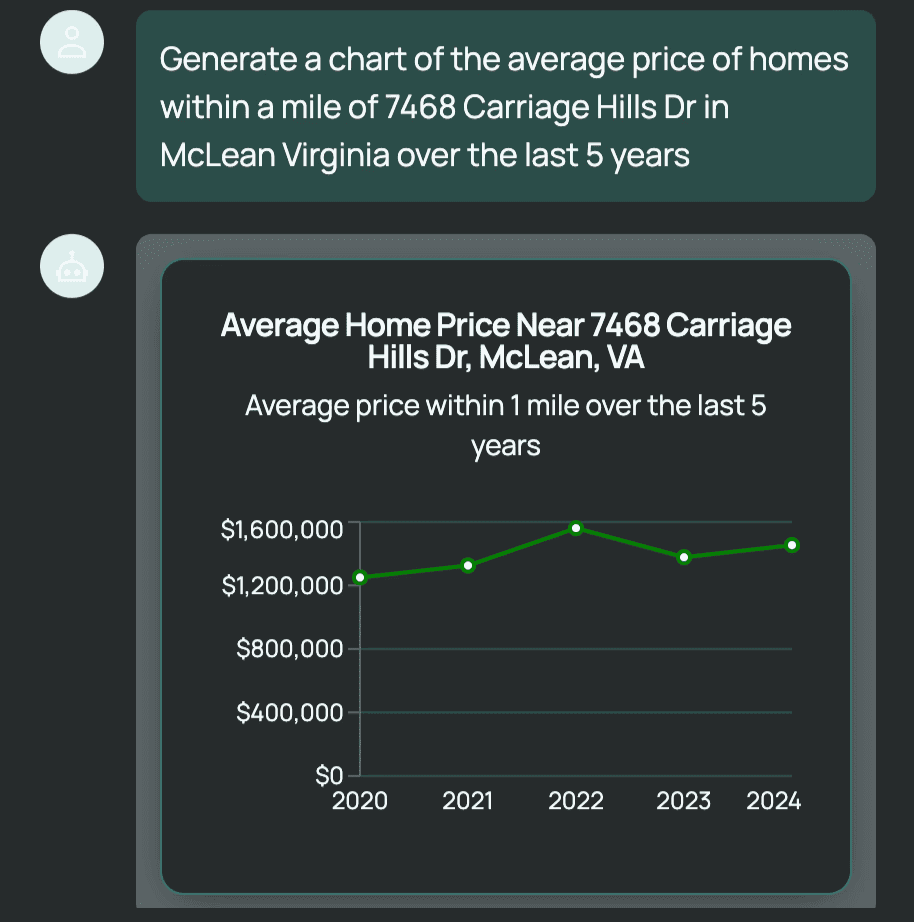

<Image of average home price near the address in question>
Great, now that we have the chart and explanation of the trend, let’s compare this against the larger market, to see if the area of the home is outperforming the greater market
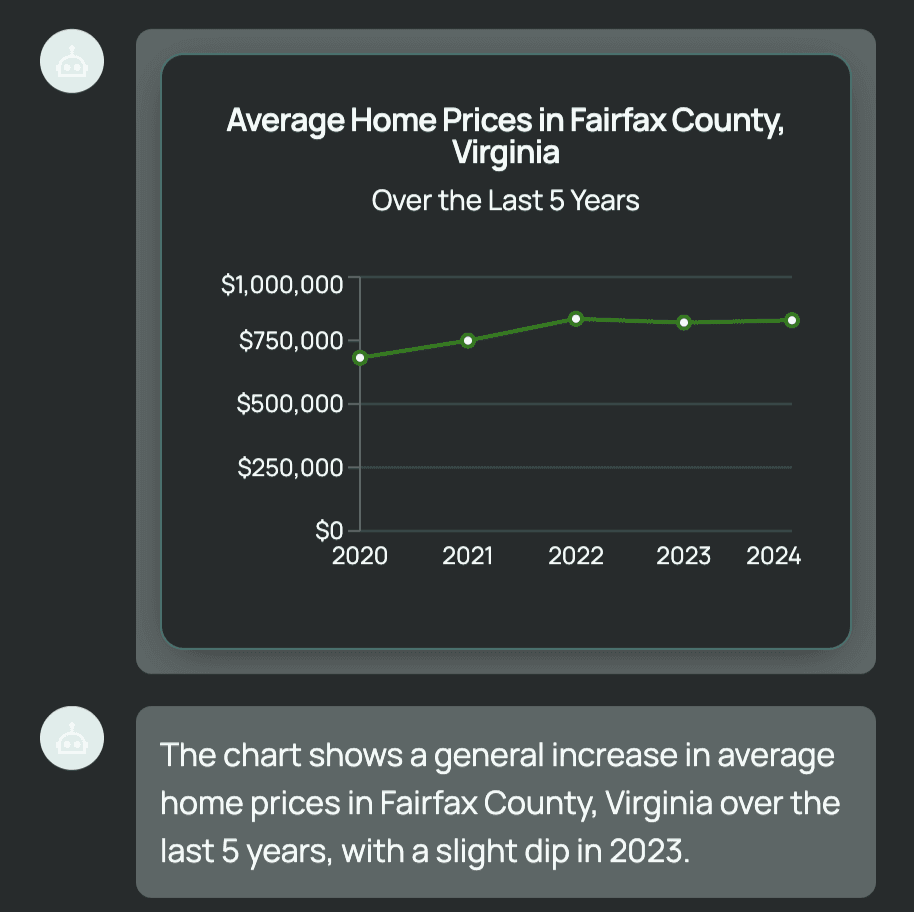
<Image of Average home prices in the home’s county>
So we can see that the average price of homes throughout the county is noticeably lower than the area within a mile of our home in question. We should really be checking trends that apply more specifically to our (a 3 bedroom home last sold for ~$1,000,000). Let’s ask the assistant to be only show trends for 3-bedroom homes to be consistent:
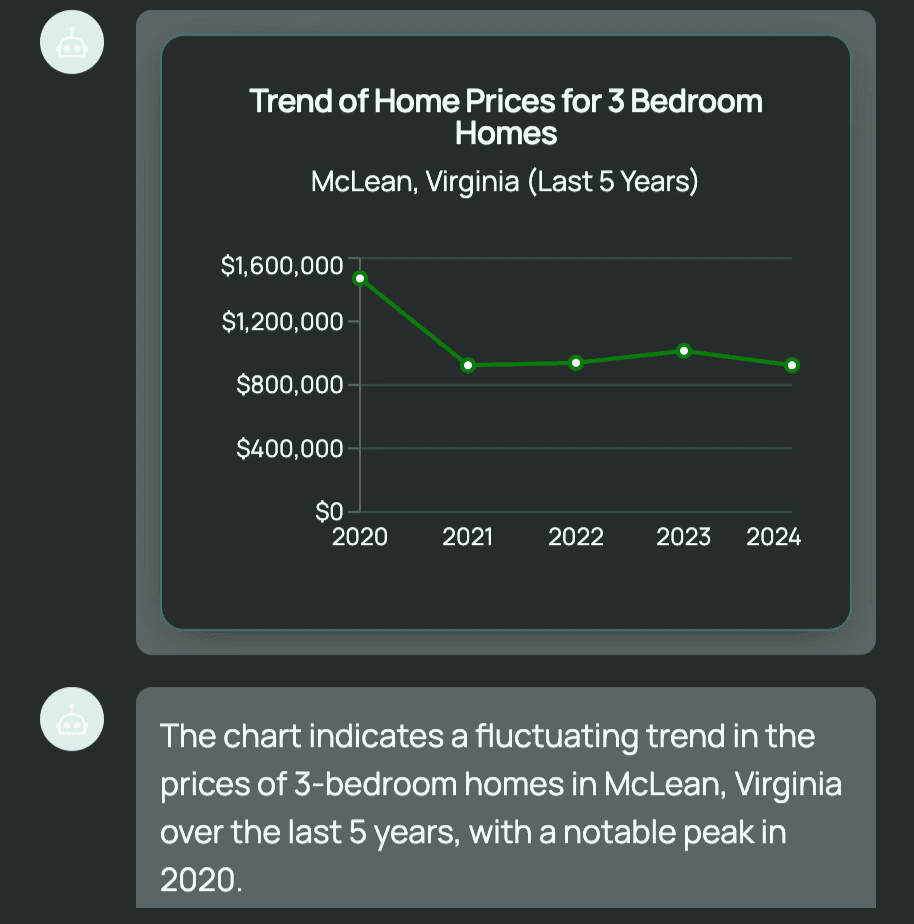
<image of chart with trend of home prices in the town for 3 bedroom homes>
Great, now we can see that there’s an interesting outlier spike in 2020 (I wonder what caused this 😉) Let’s extend out trend history to ensure that this outlier is just an outlier.
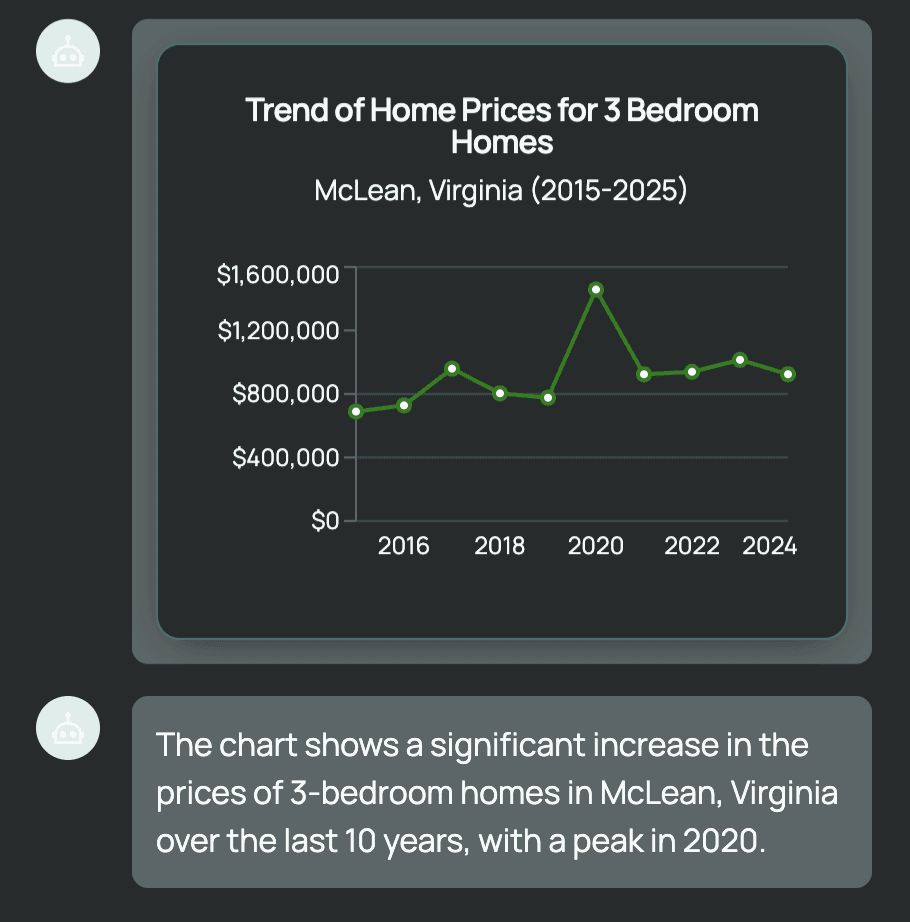
<Image of a 10 year trend>
Just as we thought, 2020 doesn’t reflect a noticeable spike, however, as the assistant notes, there is still a significant increase in home price, despite the spike,
Let’s double check to see if this trend also continues for our original home in question:
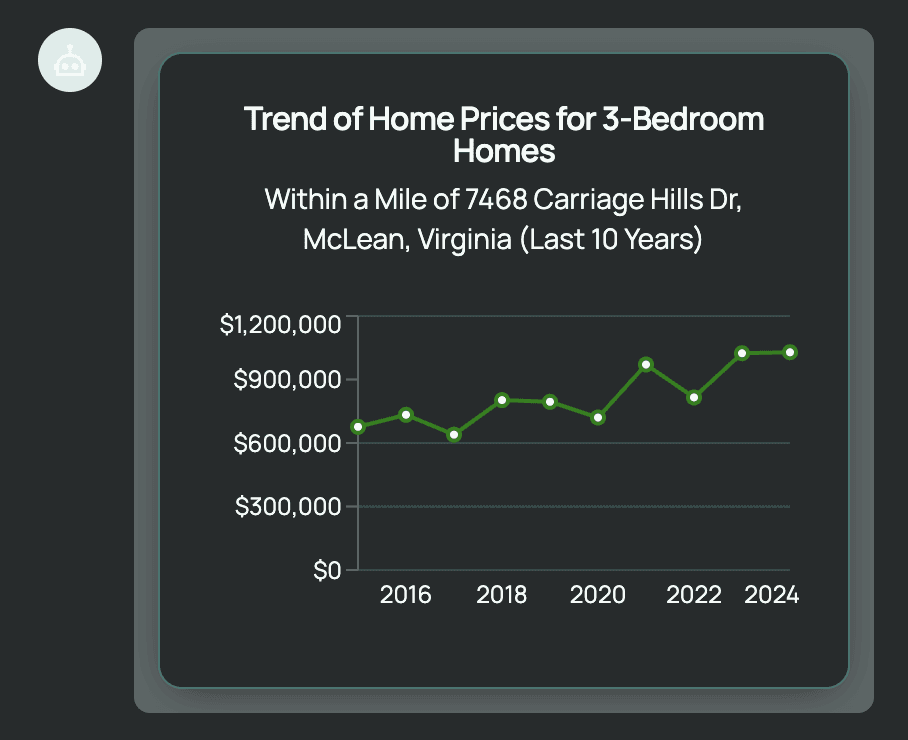
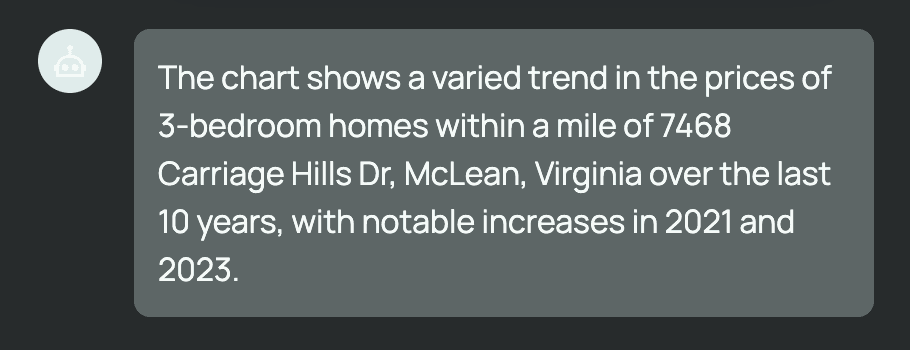
<Image of trend of home prices for 3 bedroom homes within a mile of the original address>
As we can see, there’s a larger increase than for the larger county, indicating that this area sells for a premium relative to the greater county.
We’re excited to see what you all will do with the assistant, and we’re hard at work ensuring consistency of results (as results in the beta certainly vary).
The Realie Assistant is available for free in beta, and we’d love to hear your feedback/feature requests/hate comments etc etc.
Thanks for taking the time to read, and as always, I’m available to answer any and all questions on my twitter @realie_alex
Alex
SHARE
